Understanding Competition in The Federal Marketplace If You Are a Small Business
Everyone is bombarded by this statement: “competition is intense, and it is getting worse.” It’s a great opening line if you want to get someone worried about how to make their next successful bid. I am not going to disagree or agree with the statement, because I do not know how you would choose to define the word ‘intense.’ At CLEVER-BD we prefer to deal in real intelligence (things like numbers and analytics) to help you win business, so we thought it might be fun to provide some actual numbers about what is going on in the Government market, and you can decide how ‘intense’ you think it is.
Socioeconomic Overview
So, here are some interesting numbers on the Federal Government contracting community:
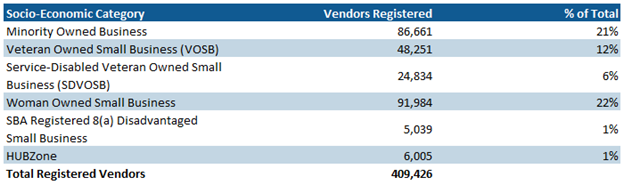
Of course, a small business in any one socioeconomic category may be registered in multiple, so you really cannot add these up or compute a distribution between them; they must be looked at individually. So, the % of Total compares each category against the Total Registered Vendors. Also, a small business may not be a small business in every NAICS code. So, there are multiple factors affecting who can bid for a procurement that is a set-aside. Nevertheless, do any of these numbers surprise you?
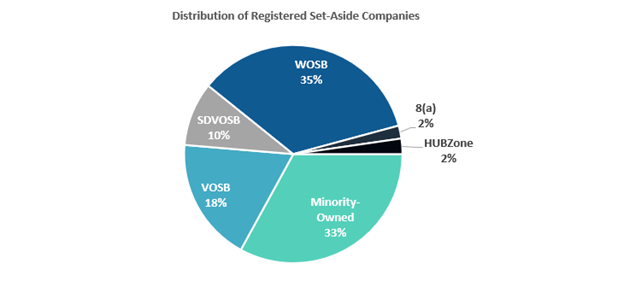
Just for fun, to get some sense of scale when a set-aside is stipulated, lets add up the socioeconomic registered companies and then look at how they are distributed. Does this say anything about competition when a set-aside is designated?
Types of Competition
Of course, if you are going to start to think about competition, then you need some idea of the other side of the coin, how many contracts were competed? In FY2019 alone there were 758,664 contracts awarded, totaling $169.2B.
Ok, I am betting you think that is a huge number of contracts, and if you knew the contracting budget for the government was over$550B in FY2019, you’re probably asking – Where did the rest of the money go? To answer the first question, yes, it is a lot of contracts, but it includes every transaction the government made regardless of size or what was purchased. As you might guess, there are a lot of small purchases. Now, the second question, where did the rest of the money go? It went into funding existing active contracts.
That’s right, when someone tells you about how big the contracting budget is, you need to remember that most of the current year funding goes into contracts that are already active, not new awards. And there are a lot of small purchases, so if we want to understand the competitive marketplace beyond small purchases, it is probably more interesting to examine contract awards over $1M. When you start to look at it this way, you see some interesting numbers:
There were 12,904 contract awards in 2019 worth over$1M. They consumed $147.1B or 86% of new contract award dollars. Out of this, there were 6,893 awards to Small Business worth $33.6B or 22.8% of the dollars spent among the 12,904 awards. The remaining $113.5B obviously went to large businesses, but through fewer contract awards – just 6,015. So, while small businesses generally do not get as much money, they do get more shots at winning a contract than a large business does.

Acquisitions
Now, do you ever wonder how this money is spent from an acquisition strategy perspective?
There were just 100 contracts from BAAs (again,over $1M in value) totaling $574M
There were 3,538 Negotiated contracts for$49.2B
There were 1,802 Simplified Acquisitions competitively procured worth $5.9B
There were 3,098 Single Source Solicited (no competition) contracts for $60.4B
There were 1,454 IDV contracts issued worth $15.8B
I don’t know about you, but that ‘single source solicited’ number certainly jumps out at me. $60B with no competition. Who is doing this? – DoD of course, but they are not alone. DoD spends almost half its budget on non-competitive actions. The top 5 agencies with the lowest % of competition are:
DoD
DOL
SSA
NASA
DHS
Want to know who does the largest % of their contract actions through competition?
DOE
EPA
NSF
USAID
Treasury
Agriculture
So, what does this acquisition strategy picture look like, and what does it mean for competition when 45.8% of the new contract award dollars goes out the door without competition? Certainly, it means the remaining dollars might be in more demand.

The logical next step would be to look at a cross section between the acquisition type and the socio-economic categories. Let us take just one example – Small Business awards via Negotiated Proposal:
1,946 awards for $13.4B. Not bad, that makes our average award value $6,885,919
However, just because it was an award to a Small Business does not mean it was a Small Business set-aside. If we restrict our data set to set-asides, we get 1,044 awards for $7.5B, which makes our average award a little larger - $7,183,904.
Summary
Did anyone do the math yet to remove the single-sourced contracts from the acquisition strategy numbers for contracts over $1M? Yep, you are left with just 6,894 new contract awards for the fiscal year. Now, there are a lot of great contracts for more than the competitive minimum of $25k that are less than $1M, but still, did you think the number was this small – or did you expect a larger number? It gets back to our original question, is the market really getting more competitive? And when someone tells you it is, on what basis are they making that statement?
The numbers in this blog are interesting, perhaps even educational. Everyone should know something about the size and behavior of the market they are in. But a lot more research would be necessary to establish year to year patterns that would reveal how the market is changing. Since we like doing research at CLEVER, we are gradually going to do this, and we will keep you posted.
There is, of course, a bigger question when it comes to competition. What does the competitive picture look like for an individual opportunity that you want to bid on? All the global market data will not answer this question. Now, you would like to know some details, like who are the other likely bidders? If there is an incumbent, what did they get paid for the work, and how strong is their contract presence with this customer? How many bids were submitted on this opportunity when the incumbent won it? Has there been some change in the scope, or the acquisition strategy – and what impact is that likely to have? These and many other opportunity-based questions are answered by us for each of our CLEVER clients – companies that let us build and maintain tailored pipelines for their government business.